# Your chart library doesn't need a dark mode
_Box Kite 2.3.1 · a markdown copy of https://www.box-kite.dev/blog/charts-that-follow-the-theme/_
_6 November 2026 · Use case_
A Recharts chart can follow your page's dark mode with no theme state and no re-render: it names CSS variables, and the page declares them. This article shows the container that declares them, the trap that catches the hand-written version, and what still needs a line of your own.
## The problem
A chart library takes its colours as strings — `stroke="#0ea5e9"` — so nothing your page does to its own theme reaches the chart. Your cards turn dark and the chart keeps its light-mode lines, black axis labels and a white tooltip. The fixes land one bug at a time: [axis labels](https://github.com/open-metadata/OpenMetadata/pull/33559) in one project, [tooltips](https://github.com/SmartDropLabs/smartdrop-frontend/issues/312) in another, [labels, series and tooltips](https://github.com/OLGAX-com/olgax-pos/pull/17) in a third, all in the last three months. Recharts itself [discussed a theming API](https://github.com/recharts/recharts/discussions/6928) through most of 2026 and is shipping one in its 3.11 pre-releases, marked experimental.
The usual fixes each cost something:
- **Pick the colour in React**: `stroke={theme === 'dark' ? '#38bdf8' : '#0ea5e9'}`. Every chart reads the theme, so every chart re-renders on a switch, and a server render has to guess the theme.
- **Variables in a global stylesheet.** This is the right mechanism, and it works until a section of the page has a theme of its own. More on that below.
## The chart names variables, the container declares them
```tsx
import { ChartContainer } from '@box-kite/react/components/chart';
import { Line, LineChart, ResponsiveContainer } from 'recharts';
const months = [
{ month: 'Jan', revenue: 12, cost: 8 },
{ month: 'Feb', revenue: 18, cost: 9 },
];
export function Revenue() {
return (
);
}
```
`ChartContainer` is a Box that declares a numbered palette, `--chart-1` to `--chart-6`, with a lighter twin of each under the dark theme. It also declares one `--color-` per name, pointing at the palette in order. The chart names no colour at all, so its dark mode is the page's.
**What a switch costs.** We put a render counter in the chart component and flipped the page from light to dark: every line changed colour, and the chart rendered zero more times. The theme is a class on an ancestor, and the browser re-resolves the variables. React is not involved.
## The rest of the chart
The palette covers the series. The grid, the axis labels and the tooltip are yours, and they work the same way: declare a variable on the container with `vars`, give it a dark value under `theme`, and name it in the chart.
```tsx
import Box from '@box-kite/react';
import { ChartContainer } from '@box-kite/react/components/chart';
import { Area, AreaChart, CartesianGrid, ResponsiveContainer, Tooltip, XAxis, YAxis } from 'recharts';
import type { TooltipContentProps } from 'recharts';
const months = [
{ month: 'Jan', revenue: 12, cost: 8 },
{ month: 'Feb', revenue: 18, cost: 9 },
{ month: 'Mar', revenue: 15, cost: 11 },
{ month: 'Apr', revenue: 22, cost: 12 },
{ month: 'May', revenue: 26, cost: 13 },
{ month: 'Jun', revenue: 31, cost: 15 },
];
function ChartTooltip({ active, payload, label }: TooltipContentProps) {
if (!active || !payload?.length) return null;
return (
{label}
{payload.map((entry) => (
{entry.name}: {entry.value}
))}
);
}
export function SalesChart() {
return (
);
}
```
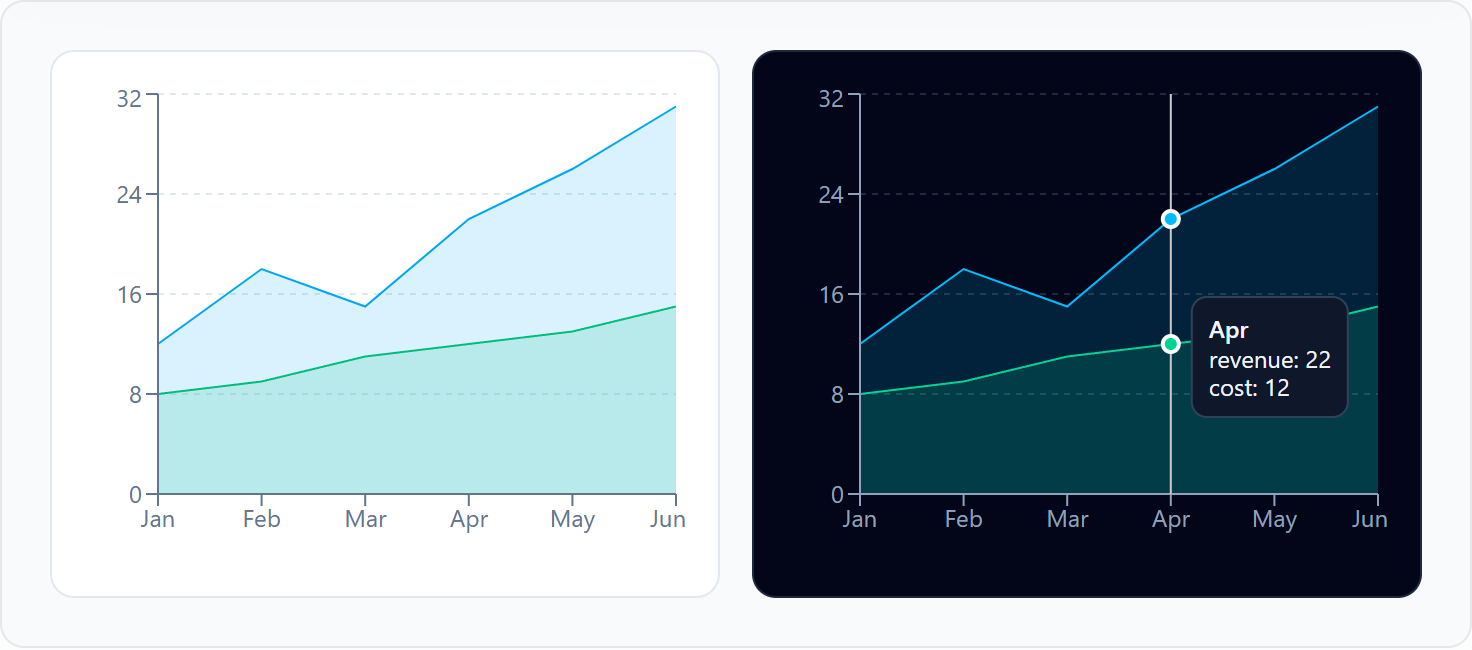
The tooltip is the one part that needs a component. Recharts' default tooltip writes `background-color: rgb(255, 255, 255)` as an inline style, and we measured it staying white under a dark theme. A tooltip drawn as a Box takes `theme` like anything else on the page.
## The trap in the hand-written version
The hand-written version is a stylesheet like this one:
```css
:root {
--chart-1: #0284c7;
--color-revenue: var(--chart-1);
}
.dark {
--chart-1: #7dd3fc;
}
```
When the `dark` class is on ``, it works. Put it on a section instead (a dark sidebar, a dark card, a preview), and the revenue line stays the light-mode blue. A custom property is resolved where it is declared and inherited as a finished value: `--color-revenue` became `#0284c7` on `:root`, and redeclaring `--chart-1` further down never reaches it. In our probe the dark section's `--chart-1` read `#7dd3fc` while the line's stroke read `rgb(2, 132, 199)`, a light-mode blue.
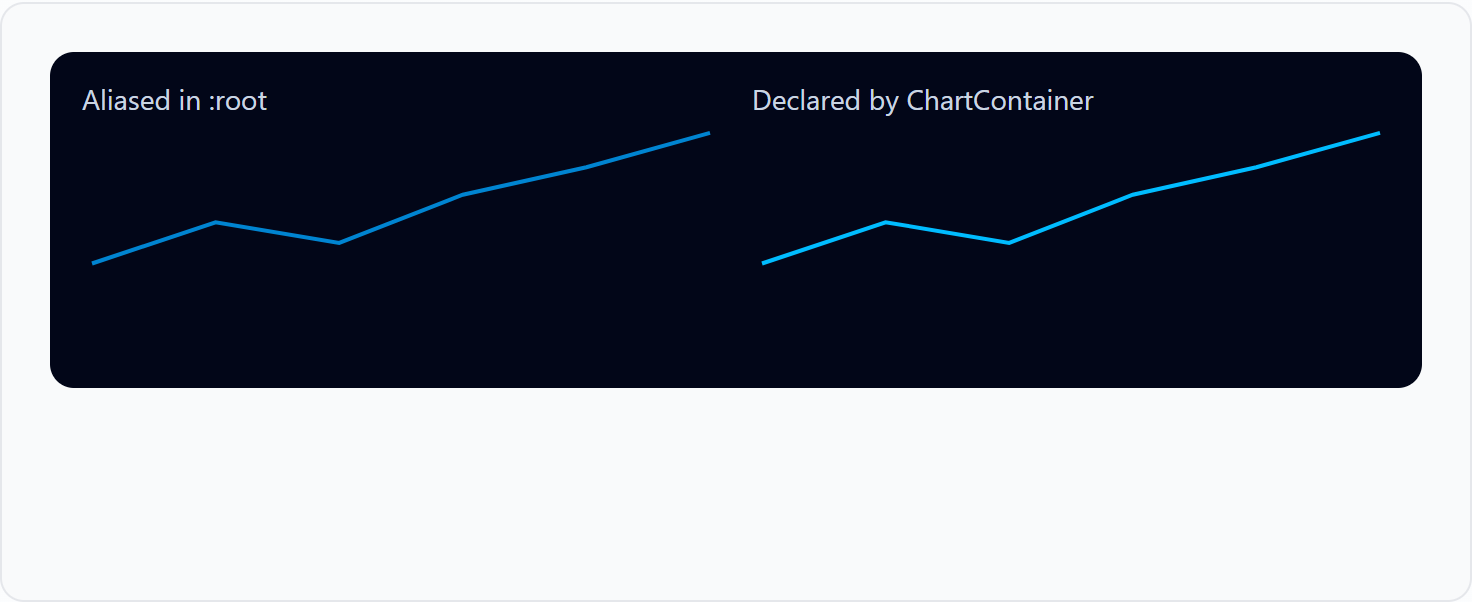
`ChartContainer` declares `--color-` on itself, below whatever theme is around it, so the alias resolves inside the section that chose the theme. Each theme rule is scoped to the subtree that declared it, so a light chart inside a dark page works the same way.
## Colours of your own
A list of series takes the palette in order. A record names each series' paint, as anything `fill` takes, including a colour with an opacity:
```tsx
import { ChartContainer } from '@box-kite/react/components/chart';
import { Bar, BarChart, ResponsiveContainer, XAxis } from 'recharts';
const weeks = [
{ week: 'W1', completed: 4, started: 3 },
{ week: 'W2', completed: 6, started: 2 },
{ week: 'W3', completed: 5, started: 4 },
{ week: 'W4', completed: 8, started: 2 },
];
export function Goals() {
return (
);
}
```
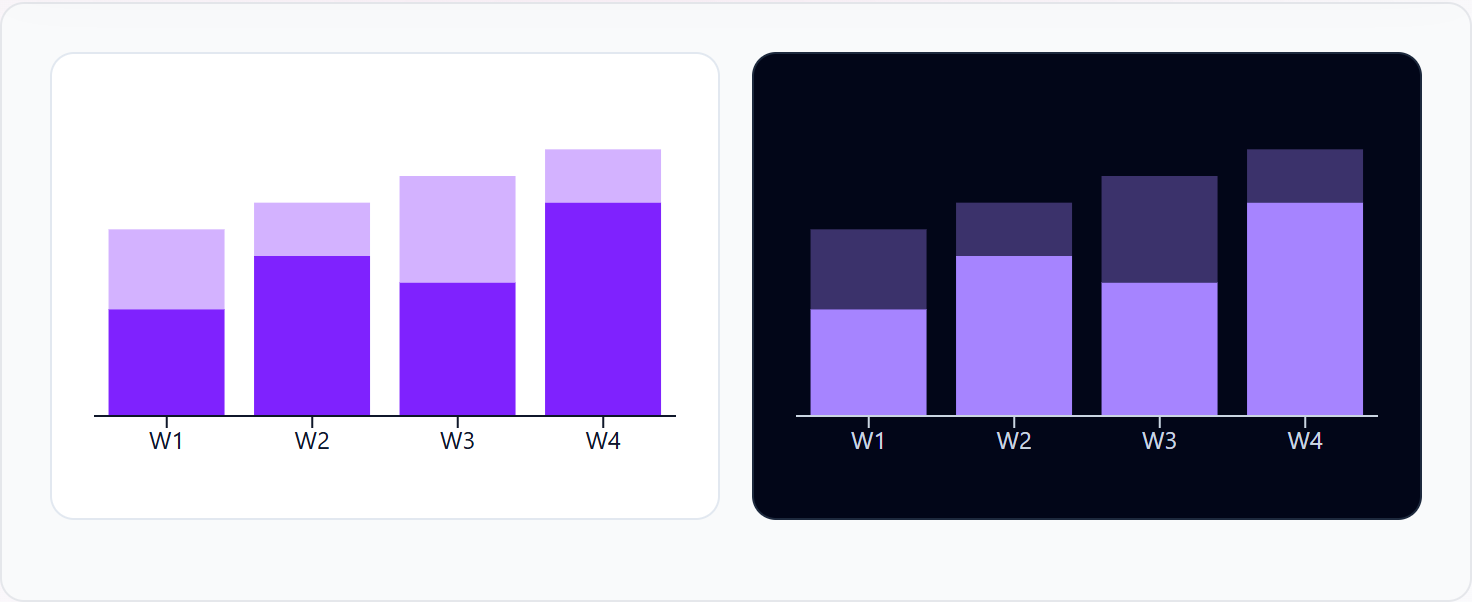
A named paint is the same in both themes, so the dark value is a `theme` override, and we measured it winning. A paint the palette does not have (`'tael-500'`) declares nothing. In development it warns, with the nearest token: `Did you mean "teal-500"?`
## The honest limits
- **Every series still names its variable.** Recharts takes one string per `` or ``, so `var(--color-revenue)` is written once per series. A variable nobody declared paints nothing: our grid disappeared until `--chart-grid` existed.
- **A canvas chart cannot read a variable.** `ctx.fillStyle = 'var(--chart-1)'` is ignored (we checked), so a chart that draws on a canvas needs the resolved colour from `getComputedStyle` and a redraw on every theme change. This approach is for SVG charts.
- **The palette has six slots**, and a seventh series wraps round to the first colour.
- **Theme rules need `@scope`**: Chrome 118, Safari 17.4, Firefox 128 and later. Below that, the light values show.
- **Recharts' own themes are coming.** Its experimental provider takes a theme object per chart. Its CSS-variable example uses the same `--chart-1` names, declared by hand in a stylesheet. The container is that stylesheet as a prop.
## Try it
- [Charts](https://www.box-kite.dev/charts): the container, and the small charts that need no library at all.
- [Dark mode without the flash](https://www.box-kite.dev/blog/dark-mode-without-the-flash): the theme the chart follows.
- `npm install @box-kite/react recharts`, and wrap one chart in ``.
---
_Every page: https://www.box-kite.dev/llms.txt · every prop, measured: https://www.box-kite.dev/props.md_